Fordham March Madness
Dashboard - Mar 2018
Why?
Each year, students in Travis Petersen's (Sr. Data Scientist - MLBAM) Fordham Sports Analytics spring class create models to predict the outcomes of the NCAA March Madness tournament. Initially, the class was using a google sheet to track results
How it works
I developed a site to summarize the results of each game and the performance of the class' predictions. On the homepage, you can see the loss (error) of the classes predictions. Click into each date to see the results of students' predictions
What it's made with
React (Frontend)
Flask (Backend)
Screenshot
Click to enlarge
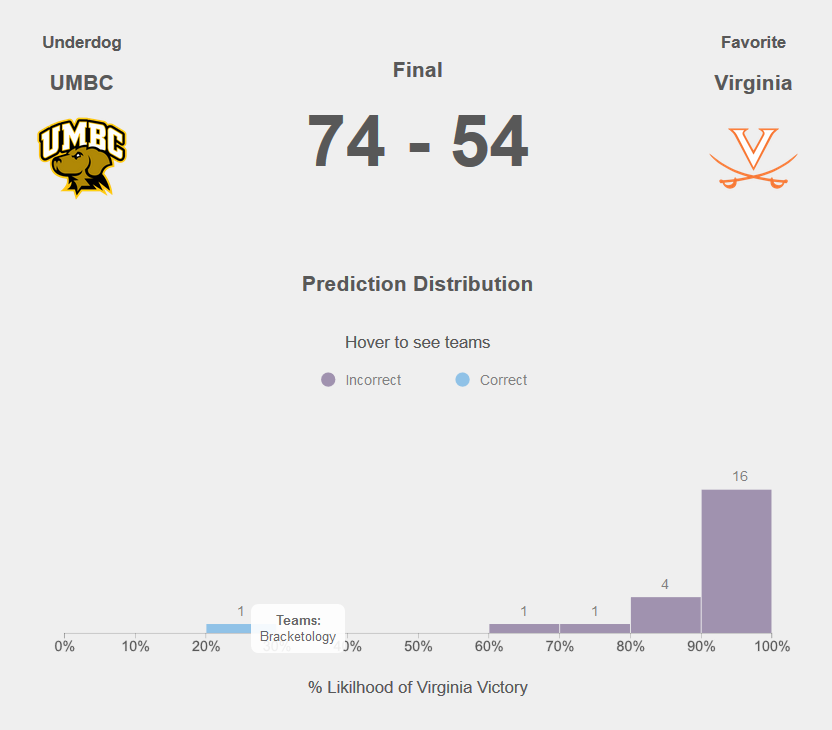
Results page showing a distribution of estimated likelihood of winning for the March 2018 tournament
×
![]()